June 12, 2014
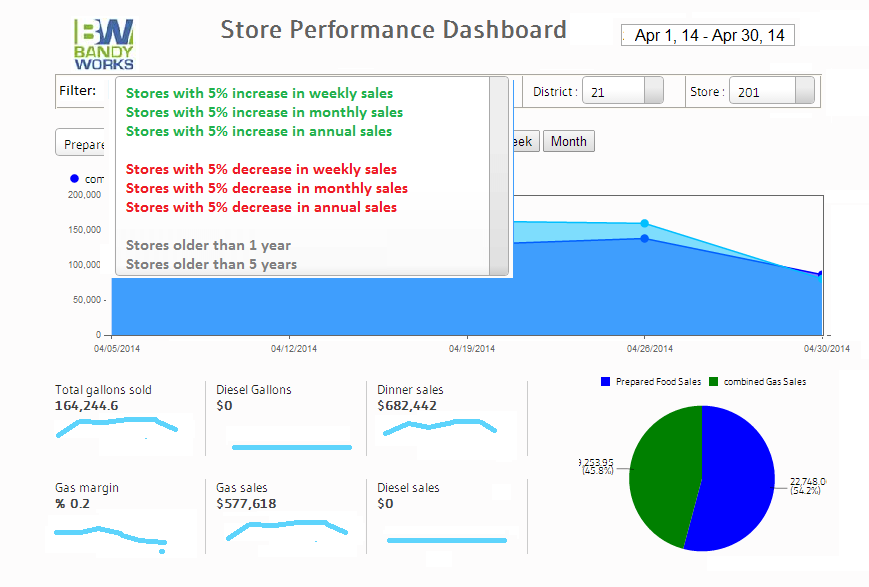
One of the ironies of Big Data is that insights often look like just a few points of data. The ability to extract the right data from large quantities of data is one way to move toward the insights. Filtering data into groups is a technique that allows related information to highlight a big trend in a particular group that may be hidden when viewed in a larger set of data. For example, key relationships for top sales performance can be lost when looking at summary data of all stores regardless of their relative sales performance. The goal of convenience store performance dashboards is to be simple. By adding simple statements, C-Store operators can look at key data groups to understand what is causing both good and bad performance. For example, ‘Average age verification is 17% for beer and wine.’ Filtering key data with short summaries is better.
Combining grouping filters along with other selections such as date range, regions, districts and stores allows interesting sets of data to be analyzed with little effort. Examples of filters that can be used for C-Store Analysis include:
- Sales changes over a time (day, week, month, quarter or year)
- Categories (e.g., rural, urban or suburban)
- Traffic flow
- Seasonally dependent (e.g., Summer versus Winter)
- Staff Turn-over
- Management experience
Adding new groupings with understandable criteria enables different views to be studied. Once an analytical tool is in place, it is a simple process to add new criteria. Slicing performance data is a powerful way to understand important performance information. Getting results quickly improves performance and identifies other things to study. It is a simple process to add additional filters to a dashboard to continue to dissect and better understand key performance trends.
The Convenience Store Performance Dashboard combines unique analytical grouping filters with the standard filters such as date range, region, district, and store to provide a simple method of business analytics. C-Store operators need not have extensive technology or Big Data skills to spot trends. Tracking and Accountability for Convenience Store Performance is enabled with a ready-to-use dashboard that presents information the way C-Store operators think and work.
Establishing a powerful dashboard for business analytics does require strong technology skills. The process need not be overly time-consuming or hard to use, however. It is a straight forward process to extract and transform data from the mainstream C-Store systems such as ADD Systems, PDI/Enterprise, DataMax Envoy, Factor Store Trak or most other commercial systems. Pentaho CTools is a great product to build dashboards and enable them to work with any data source and allow for easy modifications.