April 6, 2014
Managing Convenience Store performance like Google analytics manages a web site. Google analytics uses key performance indicators to show how a web site is performing. With this information you can track your web site performance and determine how your marketing programs are working in terms of bringing people to a site and getting them to purchase items. A similar approach can be used with your convenience store data. It is not difficult to create a custom dashboard using your existing data for sales, costs and service. With an effective dashboard you can see your key performance indicators for your store performance.
Most companies have data about their sales, costs, staff hours and other key measures. Not everyone has the data in a format that can be easily reviewed to monitor trends over time, by store (district and region), by product, by service or any other key metric that needs to be managed. POS data is rich with the data you need. Adding analytics helps drive c-store systems such as PDI/Enterprise, DataMax Envoy, Factor and other back offices. Everyone has a back office. Next, start performing convenience store performance analytics.
Using a basic dashboard template that is configured for convenience store performance, you can quickly understand how you are performing and learn how to drive results. To save time, use a dashboard template based on the concepts and ease of use found in Google Analytics so that you have the ability to track trends, identify key performance metrics and enable accountability to your goals. This model allows you to mix and match parameters to see key metrics across a selected time range for specific stores, districts or regions. Once the base system is in place, further customizations can easily be made to support marketing or other goals.
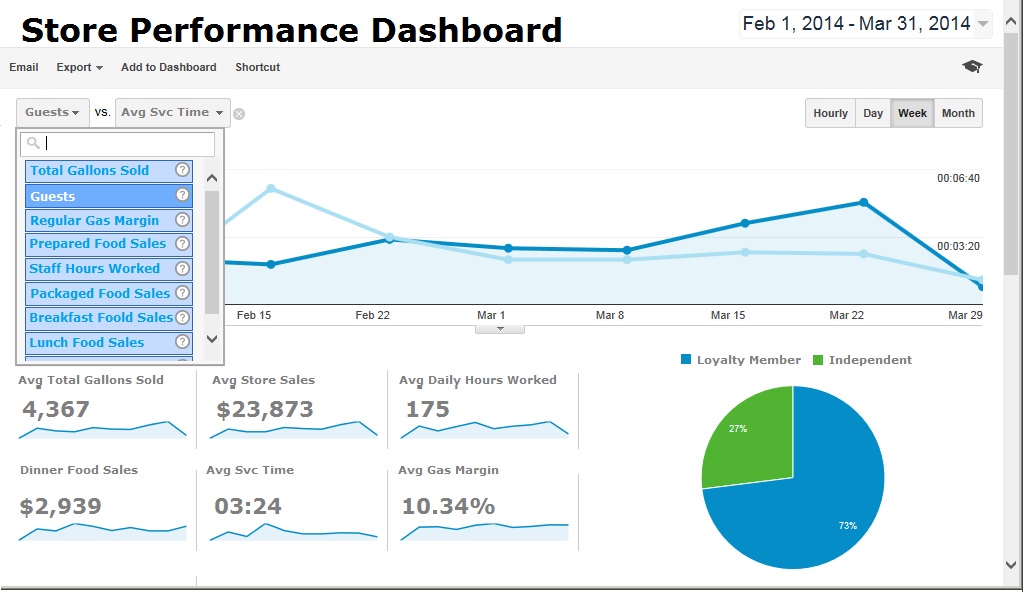
The example below uses the graphing and selection approach from Google Analytics to allow easy changes show you how your stores are performing.
Our tool of choice is the Pentaho CTools to make our dashboards. It is an open source product that allows you the power of Data Analytics from one of the leading Big Data tools without having to purchase any software.