November 4, 2015
All convenience stores share and print spreadsheets with the latest and greatest performance statistics to let managers know where to focus and what is going well in their company. However, a single snapshot in time may not really relay what is going on as much as you think it might. Yes, current spreadsheets will tell you if what was sold in a given time frame was enough, as well as who your best performers are for that time period. But, comparing sales over various time intervals can tell you a lot more. There are 5 things sales over time tell a c-store:
- Are sales declining or increasing?
- Are these results typical for this time of year or is this a variance from the norm?
- Who are consistently my best performers?
- Which products consistently sell well even when overall sales are in decline?
- Are our plans for growth working?
Time Interval Analytics Show Trends
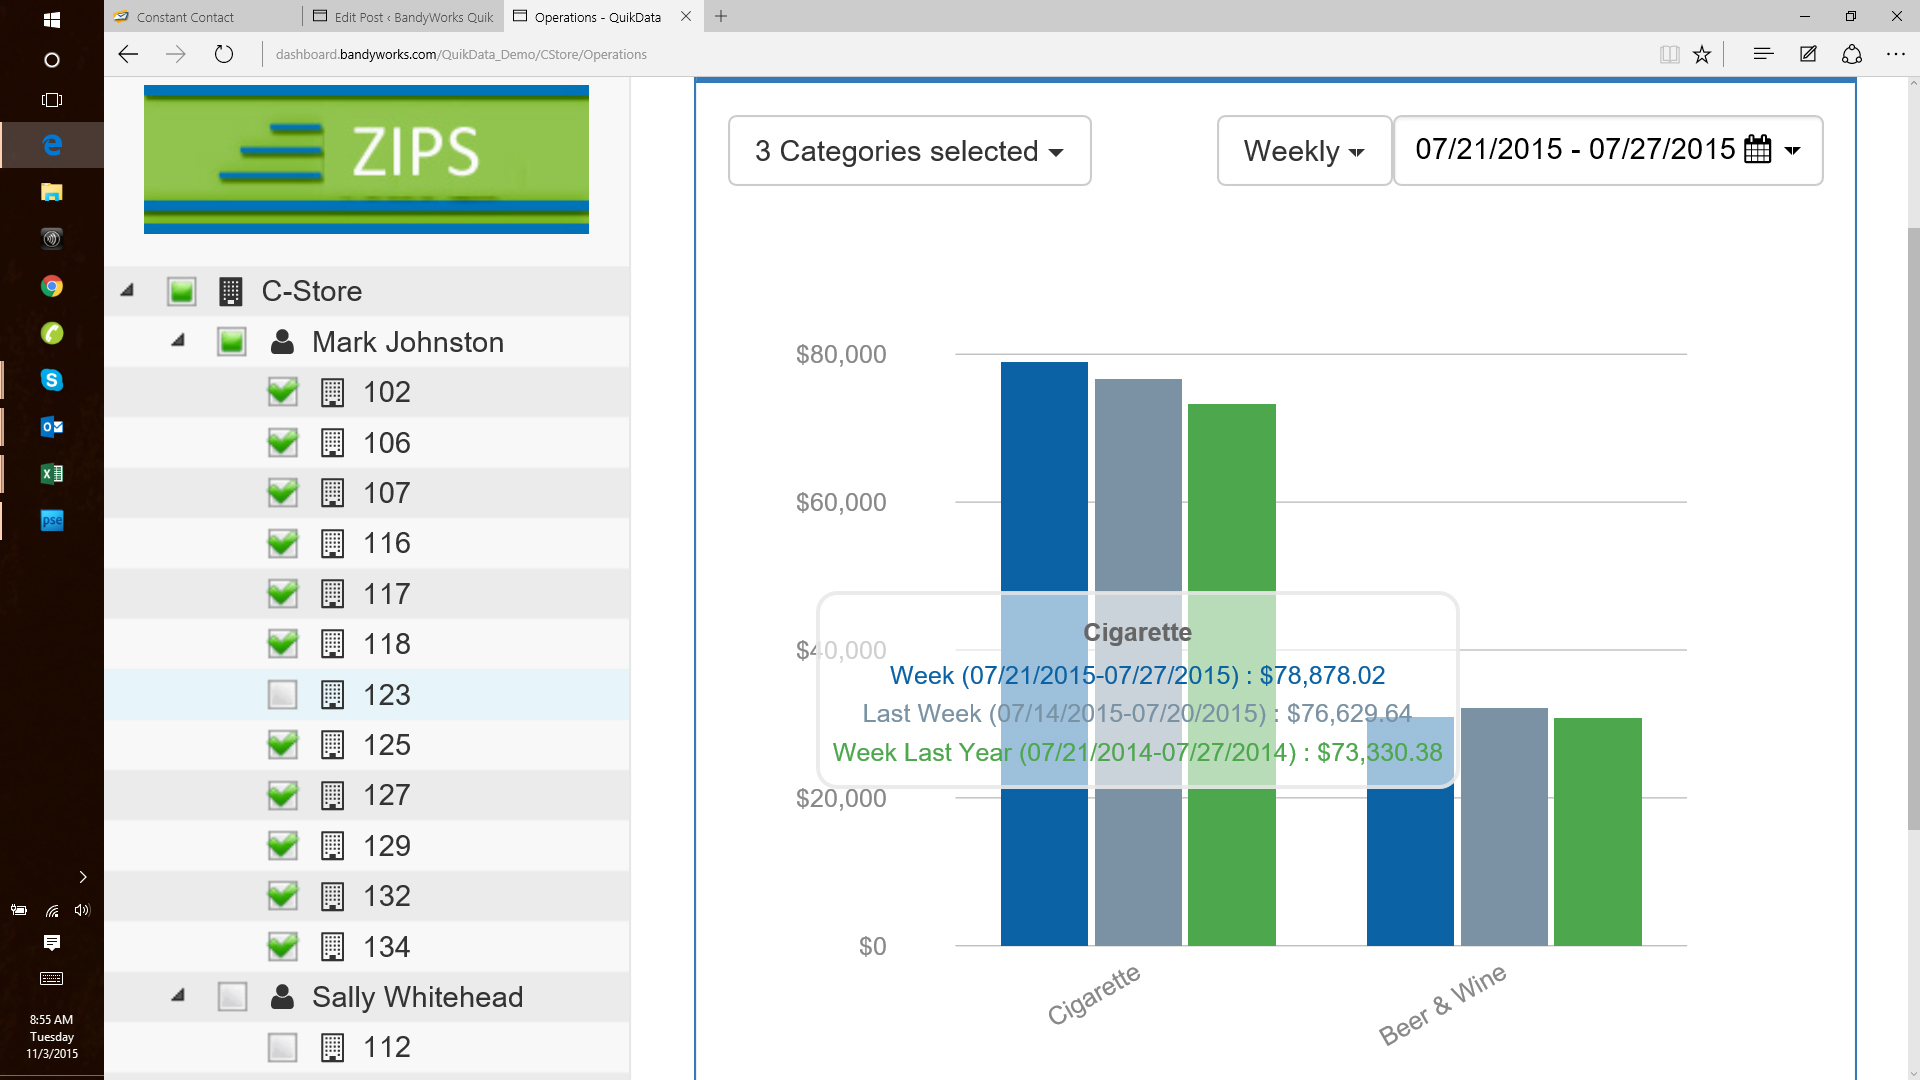
In a nutshell, time comparison provides you with the insight of trend. Trends better relay whether action is to be taken, and often times what action is to be taken, whether they occurred in the past or are current. Having a tool that provides visual insight to your specific industry and in a format everyone in your company can understand, only quickens the identification of what are typical trends and what are ones that need correcting. So, a tool that identifies trends instantly will resolve problems much sooner than paper reports and manual tracking.
Compare BI.com wrote “How Visual Insight Business Intelligence Reporting Works. “Visual Insight translates the data from the business intelligence reporting into visualizations which makes it easier to read and understand. Because being able to read and understand your data is so important. This has worked well for a multitude of different companies and has saved a lot of time consuming work by IT departments. This not only benefits your employees but your company as a whole.” It takes the element of the time comparison to automate and provide the visualization of the trend. It takes a tool to analyze all that is required to identify trends.”
C-Store Timeframes Matter
You know that looking at the same convenience store data in different time frames will give you different information. Using Over/Short data in a daily view will make you aware of problems as they arise, so they can be addressed. But, monthly views of this same information may point out a trend, which may be stemming from a training issue, which is more serious.
C-Store sales viewed in the monthly view, may give you an idea if you are to hit your goal, but a yearly view will give you a more definitive way to define which way sales are trending, and if trending downward, where larger projects may be needed to turn things around. Until you see the overall effect, you may be unsure what the monthly trends mean to your business. Things go up and down each day in this industry. The overall view gives you the result of the trend. This view can also measure improvements, marketing program success and management performance.
Annual views will provide you with an even higher level of understanding. When you grab a snapshot of your overall sales over a period of years, and compare it to the monthly sales, over that same period it will let you see when things rose or fell. This will lead you to a better understanding of your trends and, when you need to plan for defensive strategy during the year, to make sure next year’s overall results will show improvement
Perspective Tells a Story
Having the option to look at information in different time frames will give you the different perspectives you need to make sound decisions. Where one will provide you with the symptom, the other may provide you with the answer. The best answers identify the core problem. Remember, however, the symptoms often spark the search!
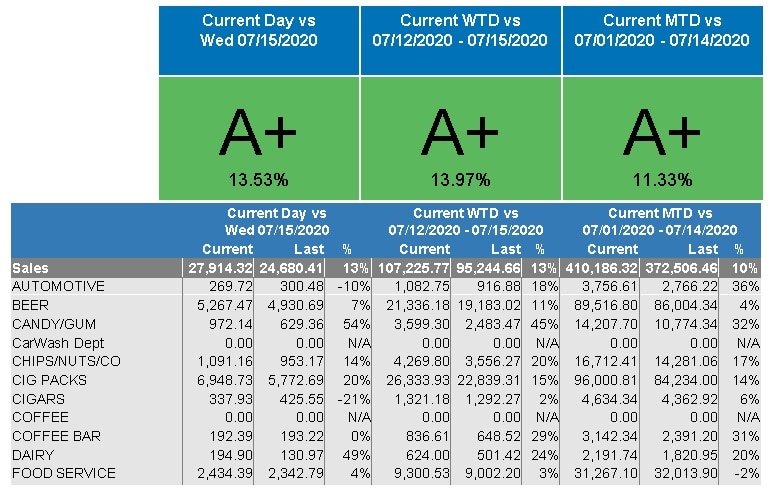
Here is an example of comparing category and inside sales daily, weekly and monthly. The key to comparison is context. The same day of week, the same week last year and the same month are used.

When observed only on a daily basis, data can look sporadic. There are good days and bad days whether you are trending in the right direction or declining. Only over time can you determine which way things are truly heading. The coordination of using these different views in synchronization is how you get results with the Business Intelligence tool. Having easy access to all different views at once makes it possible.
C-Store Analytics – The Time is Now
While analyzing all of the data as it relates categories in a manual method is not feasible on a daily basis, scan data analytics makes it easy. Having a tool to do that for you will make your company more responsive. It helps zero in on the right activities to find better ways to work. Since there are 5 things sales over time tell a c-store, it makes sense to get started and use a few.